Blog
Three steps to delivering ROI with analytics from your kiosk deployment
Big data gets all the headlines these days, but it can easily lead to information overload unless you utilize these three proven steps to manage and harness the data from your kiosk deployment.
July 17, 2015 by Chris Gilder — Founder/CEO, Meridian
 ChatGPT
 Grok
Grok Perplexity
 Claude
Big data gets all the headlines these days, but it can easily lead to information overload unless you utilize these three proven steps to manage and harness the data from your kiosk deployment.
Collection: This is the simplest step but is also a fundamentally critical one. In order to collect data, your kiosk must have software tools in place that will gather the different types of key information. There must be a mechanism where important data points are collected; these are primarily going to include usage stats – touches, length of transaction, usage of specific components etc. The collection of this data is a vital first step. Choosing software that is equipped to handle and gather this information is crucial when planning your self-service kiosk deployment. But simply storing this information would be meaningless. It is what you learn from the data that matters. That brings us to the next step in utilizing data from your kiosk deployment to deliver ROI: reporting.
Reporting: When it comes to answering the question of what to do with your data, there is a sequence of necessary responses. The first is that the data must be compiled; this is reporting. Reporting is the process of organizing data into informational summaries in order to monitor how various aspects of a self-service kiosk deployment are performing. If you have multiple kiosks in the field, whether it is 10 units or 10,000, there has to be a mechanism by which this reporting is done that is not tied to each local machine. The best solution for this is remote monitoring software. A good cloud-based remote monitoring solution will give anyone tasked with managing a fleet of kiosks the access to dashboards with a variety of customizable reporting tools. Once the data has been collected and then compiled into reports, the next step is to dig in and learn. Enter analytics.
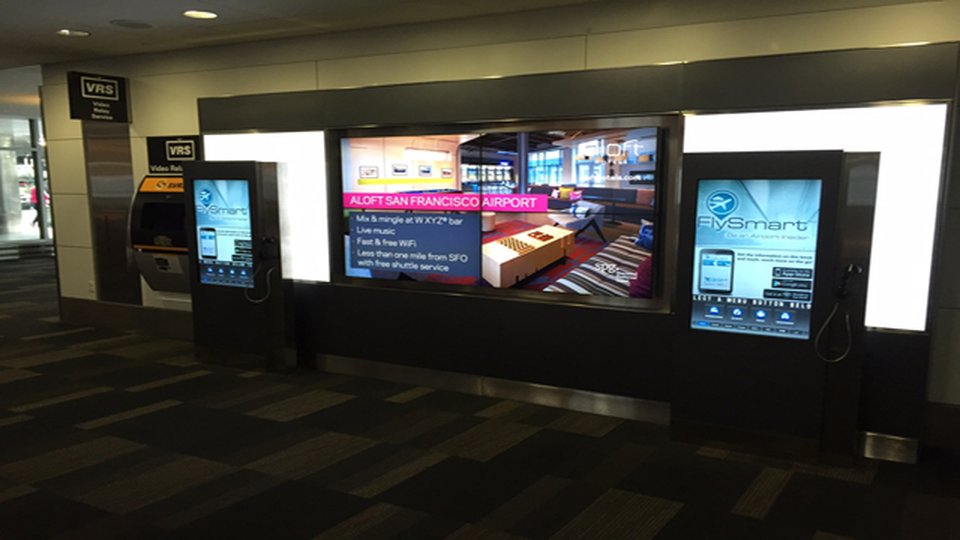
Analytics: Once data have been collected and then compiled into useful reports, there must be a final step of looking at the data in order to gain knowledge. Analytics is the process of exploring data to see patterns and extract meaningful insights, which can then be used to better understand and improve the performance of a kiosk deployment. For example, Clear Channel Airports has 130 interactive digital signage kiosks deployed in 28 different airports throughout North America. Using remote monitoring software, Clear Channel’s team can compile reports on specific sets of kiosks. Then based on the reports, an analysis may show that of the nine kiosks located at the San Francisco International Airport, two are under performing when it comes to number of times used in a week. By analyzing the data, Clear Channel gains an important insight that can then be acted upon. Perhaps they realize both locations are very congested. The kiosks can be moved and the data analyzed again to see if the change worked. Additionally, all the data collected by Clear Channel helps it to drive advertising revenue for the interactive digital signage platform. Without a clear picture of usage data to show potential customers, it would be very difficult to sell ad space.
When it comes to delivering ROI, collecting data and then organizing it are not enough. The true tip of the spear is analytics that leads to action.
About Chris Gilder

Chris Gilder, CEO and founder of Meridian Kiosks, brings more than 20 years of entrepreneurial successes to the senior management team. Meridian has been recognized as a leader in the self-service kiosk industry and an innovator with the development of the Self Service Technology Center in partnership with Intel, HP, Microsoft, Zebra Technologies and Storm.
Related Media
SoftwarePresented ByPROVISIO LLC
Subscribe
Get the latest news and resources from Kiosk Marketplace.